
During the COVID-19 crisis, there has been a boom in at-home video consumption across all platforms. Below are the latest trends seen across Social, YouTube, and Streaming platforms. With this large increase in viewership, advertisers should strongly consider pivoting marketing dollars into these platforms.
Overall Social Video Viewing Trends
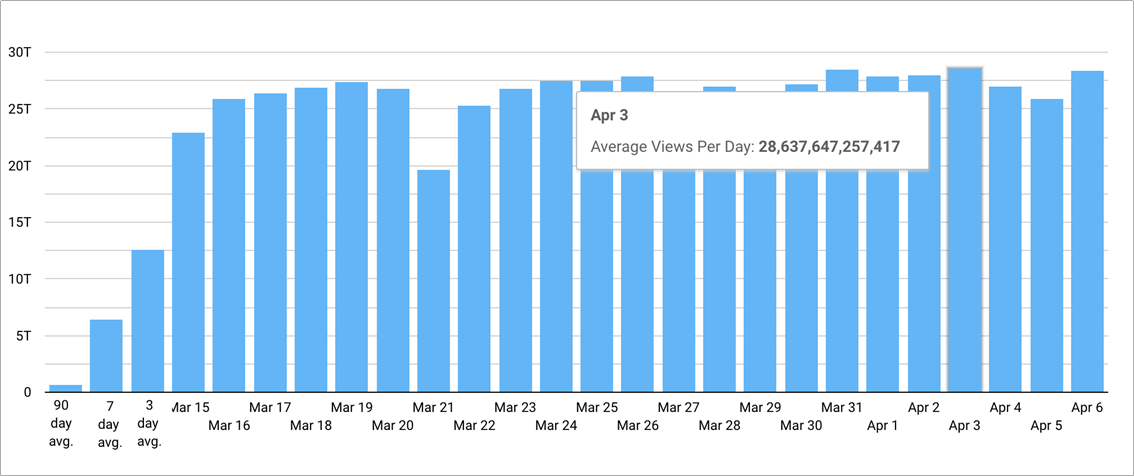
- Social Video views have seen a large uptick in the month of March and the beginning of April due to the quarantine
- On a global scale, in the 7 days prior to March 13th, all platforms averaged 6.4 Trillion views per day
- Throughout the last week of March and early days of April, social video platforms are easily clearing 25T views with April 3rd breaking a record of 28.7T views (a record that had been broken several times in the quarantine period already)
YouTube-Specific Video Viewing Trends
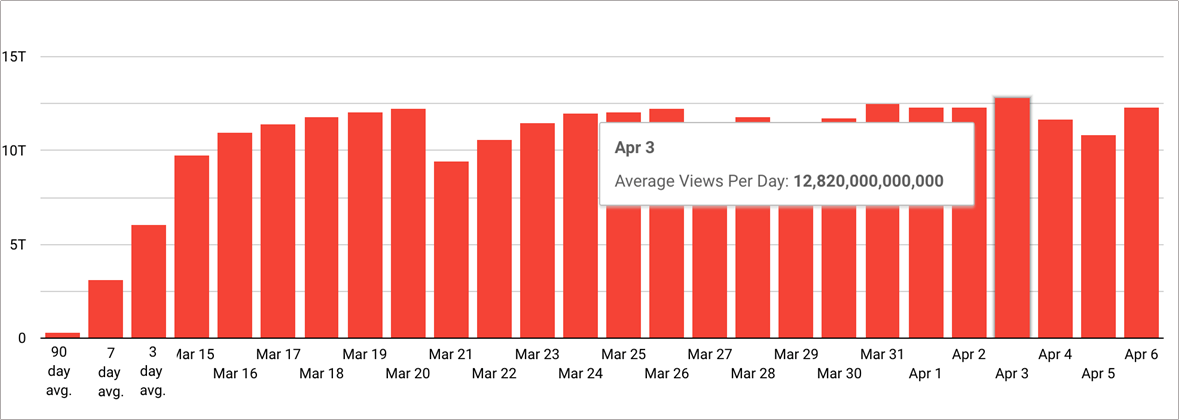
- YouTube has seen substantial growth during this period with a 3X increase in overall daily views
- In the 7 days leading up to March 13th, YT had been averaging 3.2T views per day
- Throughout the last week of March and early days of April, YT has been averaging well over 10T views with a record set on April 3 for 12.8T views making it the leading social video platform since the Quarantine began
Livestreaming Trends
- YouTube and Facebook have seen a 40% increase in daily livestream video views when comparing the daily average since March 2019 to the Quarantine period (1.5B vs 2.1B per day)
- Similarly, livestream engagement has increased by 43% from 30M to 40.7M engagements per day
Streaming Trends
(Source: Nielsen, MAGNA, E-Marketer)
- 4 out of 5 households in the US are reachable via connected devices today
- 50MM Americans have cut the cord as of February 2020
- Time spent on streaming platforms grew by 34% since the beginning of March, with collective usage going from 116.4 billion minutes the week of March 2nd to 156.1 billion in the week of March 16th
- The week of March 16th, usage of internet-connected devices like, Gaming Consoles, Google Chromecast, Roku, Apple TV and smart TV apps was up by 28% over the week prior
- Among all age groups, video game consoles had the largest usage increases. Across all ages, console use (which also includes those used for TV streaming) increased by 35%.
- One-third of streaming views are attributed to the following apps:
- Disney+, Tubi, Pluto, CBS All Access, and Hallmark Movies channel
- All have less than 9% streaming share
Esports Trends (Source: E-Marketer, FOS, MarketWatch, Torque Esports)
Given that COVID-19 has affected business demand within various verticals, it is important for businesses to evaluate how their vertical is trending and which archetype they fall under. Please refer to the charts and data above in order to make the most informed decisions on marketing investment in the coming months.
- Esports overall viewership has grown more than 17% from January to March this year, with 1.75B minutes of content watched around the world in March alone
- Twitch went from 982M hours of esports watched in February to over 1.1B hours in March, that’s a 20% growth in viewership
- DraftKings & FanDuel have pivoted to offer daily esports betting events
Conclusion
Whether it’s Social, YouTube, Streaming, or E-Sports, there has been a surge in video viewing across the globe as people stay home during the COVID-19 Crisis. There does not appear to be any sign of these high viewership numbers slowing down, with the possibility of it continuing to grow as viewing records are being broken on a weekly basis. With these increased viewer rates now is a good time to pivot marketing spend to these increased eyes. However, it is important to note that results seen during this time may not be comparable to Pre or Post-COVID-19 performance.
— Andrea Duffy-Cabana, Paid Search Associate at Direct Agents
If you have any questions – or would like to learn more, please reach out to [email protected]
Source: Sightly